5 data visualization javascript libraries for trees and graphs

GoJS
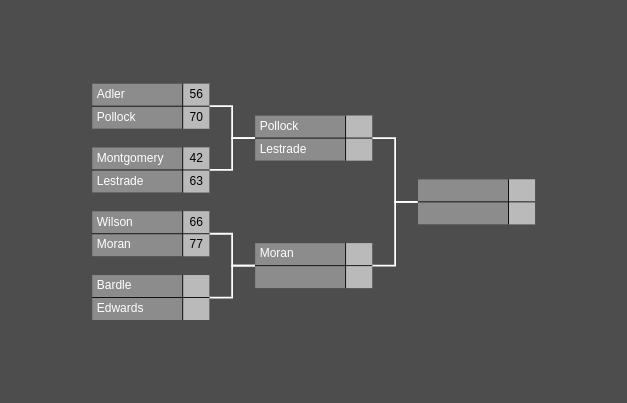
Is a feature-rich JavaScript library for implementing custom interactive diagrams and complex visualizations across modern web browsers and platforms. GoJS makes constructing JavaScript diagrams of complex nodes, links, and groups easy with customizable templates and layouts.
SigmaJS
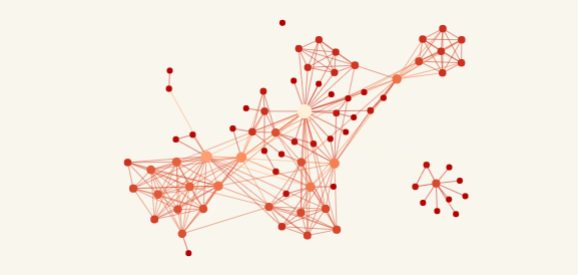
Sigma is a JavaScript library dedicated to graph drawing. It makes easy to publish networks on Web pages, and allows developers to integrate network exploration in rich Web applications.
Cytoscape.js
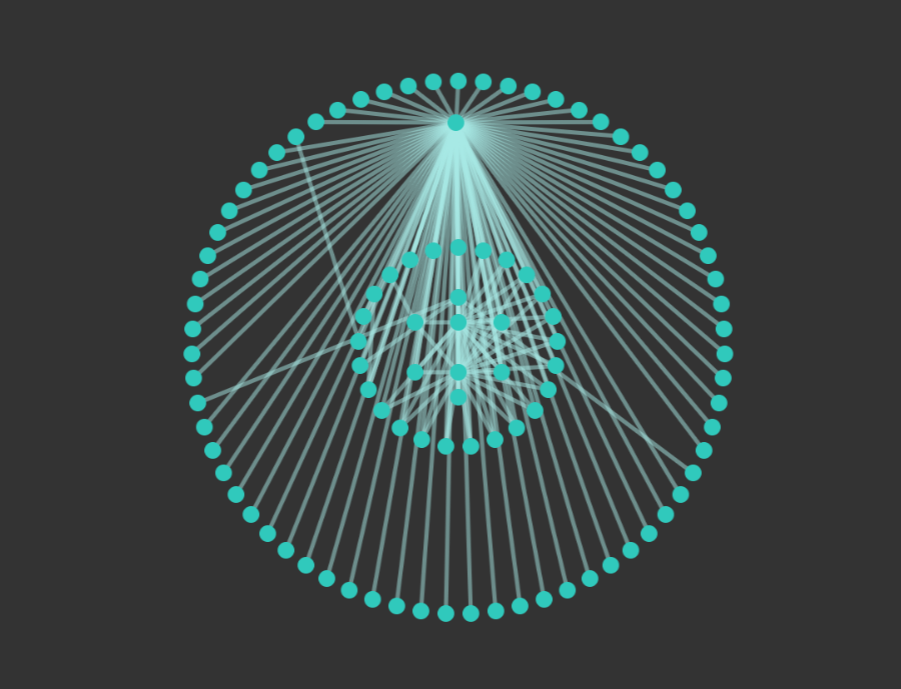
Cytoscape.js is an open-source graph theory (a.k.a. network) library written in JS. You can use Cytoscape.js for graph analysis and visualisation.
Cytoscape.js allows you to easily display and manipulate rich, interactive graphs. Because Cytoscape.js allows the user to interact with the graph and the library allows the client to hook into user events, Cytoscape.js is easily integrated into your app, especially since Cytoscape.js supports both desktop browsers, like Chrome, and mobile browsers, like on the iPad. Cytoscape.js includes all the gestures you would expect out-of-the-box, including pinch-to-zoom, box selection, panning, etcetera.
JSNetworkX
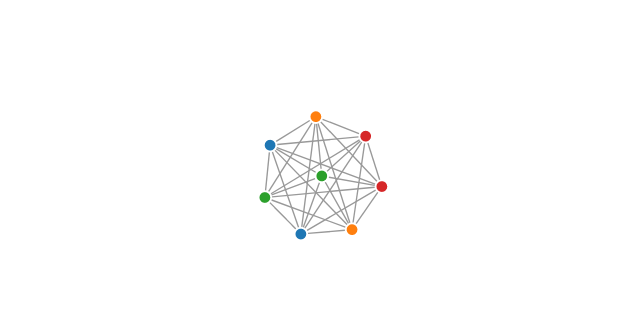
JSNetworkX is a port of the popular Python graph library NetworkX.
JSNetworkX makes heavy use of upcoming ES2015 features, such as iterators. If possible, write your code in ES2015 as well, and transpile it to ES5. If that's not possible, you can at least polyfill certain standard functions, such as Array.from, which allows you to easily convert an iterable to an array.
vis.js
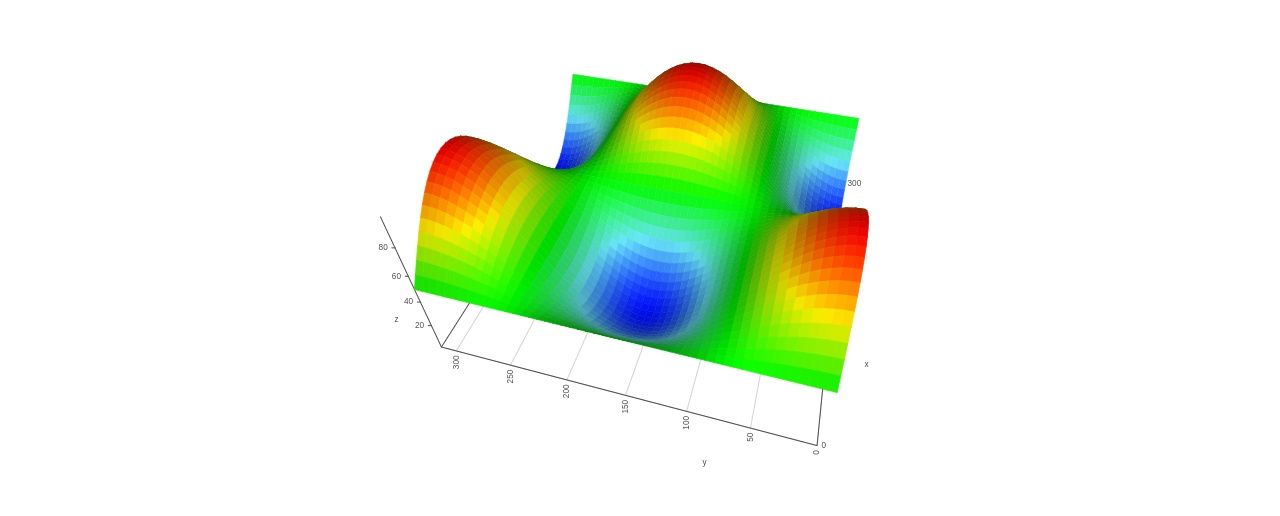
A dynamic, browser based visualization library. The library is designed to be easy to use, to handle large amounts of dynamic data, and to enable manipulation of and interaction with the data. The library consists of the components DataSet, Timeline, Network, Graph2d and Graph3d.
